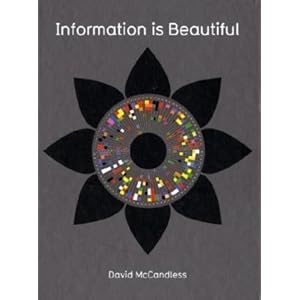
http://www.lifeaftercollege.org/blog/2009/12/11/visual-miscellaneum-book/
Maps as we know them:
http://www.ted.com/talks/lang/eng/blaise_aguera.html
how does the brain lean to see???
Gary Flake: is Pivot a turning point for web exploration?
http://www.ted.com/talks/gary_flake_is_pivot_a_turning_point_for_web_exploration.html
Some helpful sites and other examples
http://www.nytimes.com/interactive/2009/08/29/opinion/20090829-smell-map-feature.html?th&emc=thhttp://www.nytimes.com/interactive/2009/08/29/opinion/20090829-smell-map-feature.html?th&emc=th
Some helpful sites and other examples
David McCandless: The beauty of data visualization
http://www.informationisbeautiful.net/
http://www.ted.com/talks/david_mccandless_the_beauty_of_data_visualization
Taken from Ted Talks
His website: http://www.informationisbeautiful.net/
Books:
-----------------------------------------------------------------------
Bio taken from: http://www.ted.com/speakers/david_mccandless.html
 David McCandless: Data journalist
David McCandless makes infographics -- simple, elegant ways to see information that might be too complex or too big, small, abstract or scattered to otherwise be grasped. In his new book, Information Is Beautiful (in the US, it's being called The Visual Miscellaneum), McCandless and his cadre of info designers take a spin through the world of visualized data, from hard stats on politics and climate to daffy but no less important trends in pop music. McCandless' genius is not so much in finding jazzy new ways to show data -- the actual graphics aren't the real innovation here -- as in finding fresh ways to combine datasets to let them ping and prod each other. Reporting the number of drug deaths in the UK every year is interesting; but mapping that data onto the number of drug deaths reported by the UK press, broken down by drug, is utterly fascinating (more deaths by marijuana were reported than in fact occurred, by a factor of 484%). McCandless contributes a monthly big-think graphic to the Guardian's Data Blog, and makes viral graphics for his blog Information Is Beautiful.
"It's not just the sheer variety of topics covered -- though knowing the relative effect of rising sea levels or the prime vintage years for red and white wines by country will come in handy someday soon, I'm certain -- but the way in which, for many of these charts, there's considerably more than meets the eye."Chris Bilton, Eye Weekly review of The Visual Miscellaneum"
http://www.informationisbeautiful.net/leftvright_world.html

Visual-Mapping.com: Mind-Mapping, Design and Social Media
http://www.visual-mapping.com/2009/11/cycle-of-life.html
A SLIDE SHOW BY RICHARD BARLOW!!! (NOT BY ME!!!)


http://www.visual-mapping.com/2009/11/cycle-of-life.html
A SLIDE SHOW BY RICHARD BARLOW!!! (NOT BY ME!!!)
David McCandless: The beauty of data visualization
For these experiments - you will:
- Work together in an assigned pairs
- Complete the visual information mapp before the end of class & present to the class.
- As a team, you will develop your “mental map” by comparing visually 2 or 3 concepts or facts in relationship to each other of your choice. Think of this as visually tracking some kind of information (and their relationship to each other) and create a (2-D) visual of this representation of their connections between them and relationship between them
For example:
The amount of white space around an art piece in relationship to its value?
The separation between the wealthy and middle class related to economic crashes?
The ratio between Marshmallows, colors, and nutritional value (3 factors) – to sales?
Hit albums in relation to song length, album art, and market they are aimed at?
Relationship between the MIA, the Walker, and the Midway and its financial support
Ect ect
- (Avoid the cliché and often less interesting or graphic ‘floor plan’ map, but think more in the vein of graphic, mapping, and visualizing information)
Some helpful sites and other examples
Homework
READING
• Read Chapter 4: Barrett “Interpreting Art”
• Take Notes
• Be prepared for in-class discussion.
OTHER
• Find items to post in your visual resource journal
• Arrange a ride *(diving or passengers)
To meet at the Minneapolis Institute of Arts for class next week. We will not meet at CVA – but at the M.I.A.)
12:20 group C
3:25 group B
Different types of maps – mapping:
Bubble mapping
Brackets / Braces / Tree - Etc


From students of mine:
john kozak said...
I made a map of where my object has traveled and wrote a short story about the situation involved with my object being in each location.
linear history
Entertaining / mapping fictional information


No comments:
Post a Comment